Saturday, 8 March 2014

Can surfactant micelles cheat solubility products?

©2014 Federico I. Talens-Alesson

FOREWORD
What we are going to discuss here is whether a charged surface changes the solubility of a salt. If you have followed my blogs, you know that I postulate that solution chemistry is (mostly) the chemistry between of surface excesses of chemicals. A normal boundary to a solution is either the air/water surface or a wall (the container's) or a probe. However, seed crystals and colloidal particles would also be surfaces against which a surface excess may develop. This is the underlying reason for all sorts of fouling and cryytal growth/nucleation phenomena.

SURFACE EXCESSES IN SURFACTANT SYSTEMS
In the particular case of a micellar solution of an ionic surfactant (which is a type of colloidal system), it also demands saturation of the air/water interface with surfactant (which means that it also demands saturation of any other surface) forming a charged surface layer. At the time I was still publishing in scientific journals, and I went as far as to show that the critical conditions for micellisation is ionic pairing between the surface excess of an ionic surfactant and its counter ion's surface excess (Talens-Alesson, Langmuir 2010, 26(22), 16812–16817)

However, as the surface excess and concentration are related, I also showed that using Bjerrum's correlation it is possible to estimate the relative bindings of different polyvalent cations onto anionic surfactant micelles. Biding of cations onto anionic micelles is a particular case of ionic pairing, and ion pairing is key to precipitation and other reactions between electrolytes. It is through forming of ionic pairs that the building blocks for crystal assembly take place (Talens-Alesson, J. Phys. Chem. B 2009, 113, 9779–9785).

In short, the higher charge counter ion predominates and for as long as the half length of the hedge of a cube of volume (volume of solution/concentration of higher charge counter ion times Avogadro's Number) is less than Bjerrum's distance for ionic pairing, then this counter ion would bind onto the micelle. This works well for the binding of Al3+ and Zn2+ and subsequent flocculation of the surfactant SDS (sodium dodecylsulfate).

This required assigning an apparent charge of 5e- to the “counter ion adsorption patch” of an SDS micelle. This was required even though the binding of counter ions onto an SDS spherical micelle follows a ratio 1 counter ion (regardless of charge) per three SDS molecules in the micelle. This means that the binding attraction is more than it should be expected. And this brings us to the question of whether enhanced interaction of electrolytes near micelles is possible.

In practice, research on ionic surfactants focuses on how they help other chemicals (essentially organic ones) to dissolve through micellization. It also focuses on the solubility of ionic surfactants themselves in the presence of a range of counterions. The latter has to do with the presence of certain cations available (and therefore in soluble form) either in nature (soils, for remediation or oil recovery, for example) or in water in technological applications (detergency). Of course, how the surfactant may affect the solubility of something already precipitated seems a rather bizarre subject of research, particularly if one believes that chemical reactions in solution are bulk phase phenomena. Of course, I don't. And it should not be so difficult to realize that a broader investigation of how micelles affect chemical reactions should take place, considering that there is some evidence in its favor. An example of a micelle-enhanced Fenton reaction is given by Talens-Alesson (Chem, Eng Technol 2003, 26(6) 684-687).

CASE 1. EARLY EVIDENCE FOR HIGHER THAN EXPECTED COUNTER ION BINDING ONTO IONIC MICELLES.

Let us consider an aged data set, dating back to 1994, by a team from the IAST at the University of Oklahoma in Norman (Scamehorn et al., Separation Sci Technology, 1994, 29(7) 809-830). It describes binding of single cations and their mixtures onto micelles of anionic surfactant SDS.

In Figure 1 I plot my own calculation for experimental binding ratios for the cations investigated by the researchers at IAST, following:
total cation concentration minus final cation concentration in solution
over
one third the difference between total SDS concentration minus final SDS concentration in solution

together with my own predicted 'Bjerrum's” binding ratio as discussed above. There is a constant offset between the actual binding and the predicted one using Bjerrum's correlation.

If Bjerrum's correlation was correct, then binding would be lower than it actually is. But then, Bjerrum's correlation is derived on the assumption that solution chemistry is bulk phase concentration chemistry. Therefore, it is possible that there is a condition for diluted concentrations still matching the true critical ionic pairing condition at the surface excess regions. But this means that ionic pairing can occur well below Bjerrum's condition for ionic pairing: it would occur for the “surface excess” condition for ionic pairing, which would be masked by Bjerrum's use of bulk phase concentration.

This deviation is consistent with the fact that above saturation the surface excess is constant: above the saturation surface excess the value is independent of the concentration, and therefore the condition for ionic pairing appears to be a constant. The additional binding at a lower concentration would be a constant amount, related to the difference between the saturation surface excess and the critical surface excess for ionic pairing. Figure 2 shows this.

This does not imply that the linear relationship can be stretched indefinitely: Figure 3 shows some data by IAST researchers for 4mM counter ion concentrations, below a Bjerrum's concentration (would be 4.5 mM for a divalent cation against an SDS micelle). In these experiments the variation is in the SDS concentration: from 100 mM, to 200 mM and on to 400 mM. The concentration of counter ion is always 4 mM. As the concentration of surfactant increases, the binding drops which is consistent with the fact that there is more surfactant colloidal surface for the same amount of counter ion. As the ratio surface to volume increases, with the ratio surface excess to concentration being basically constant at low concentrations, then the total amount of solute is distributed over a lower surface excess matching a lower concentration. The binding ratio decreases but the total binding slightly increases. Binding of counterions onto ionic micelles may therefore exceed theoretical values and micelles are attractors of counter ions.


CASE 2. IONIC PAIR-DRIVEN INCORPORATION OF ELECTROLYTES ONTO AL3+/SDS MICELLAR FLOCCULATES.

Paton and Talens (Langmuir, 2002, 18 (22), pp 8295–8301) describe competitive binding of Al3+ and Zn2+ onto flocculating SDS micelles. The results indicate that the total charge of cations exceeds that of surfactant in the floc in some cases, with apparent charge ratios higher than 1 and sometimes up to 1.8 (Figure 4). The only explanation is ionic pairing between said cations and sulfate anions present in the solution. This leaves them as lower charge species and more of them are required to reach electroneutrality around the micelles.

This means that the flocculate is a mixture AlxZnyDSzSO4t. It is important to notice that the concentrations of all the chemicals are below their solubility limits. Aluminum sulfate and zinc sulfate are soluble at higher concentrations than the ones the flocculate forms. The excess chemicals are “opted in” into the flocs irrespective of their solubilites.

This means that a discontinuity in the solution, with the ability to cause enhanced adsorption of counter ions, may lead to enhanced capture of ionic pairs/salts. In a subsequent paper it was proposed that ionic pairs AlSO4+ and ZnSO40 may co-adsorb onto the micelles (Talens-Alesson, J. Phys. Chem. B 2009, 113, 9779–9785), explaining this apparent charge inversion. However, this explanation does not change the fact that well below their saturation conditions, fragments belonging to the Al2(SO4)3 and ZnSO4 salts are incorporated onto the flocs.

CASE 3. QUESTION MARK EXPERIMENT.
This is a peculiar experimental result, as it is reported as part of a fraudulent effort consisting in two papers in which staff at the University of Nottingham (one of them eventually moving to Oxford) plagiarized work of mine to pretend that they were active in the research of micellar flocculation.

In the second of them, published in Separation Purification Technol (2008) they claim flocculation of AL(DS)3 from solutions in which the residual Al and SDS concentrations they claim to have found (far below normal results in micellar flocculation of Al(DS)3) could only be explained by a strange charge ratio of around 4/1 between Al and DS (assuming the concentrations given where Al3+ and not aluminum sulfate, in which case it would be around 8/1). While in pH adjusted solutions it is possible to have rather high ratios Al3+/SDS (2 to 1), this only happens because in the adequate range of pH Al13 is present. The authors of this document do not state such pH adjustement, and the concentrations of surfactnat and SDS do not justify the charge inversion, as observed in previous work. A number of documents on the case of this story on plagiarism and fraud are available on the net.

However, there is a question: considering that various other statements make absolute no sense (stating that benzoic acid is a reagent for the analysis of anionic surfactants in two phase titration, that the formula of aluminum sulfate is AlSO4, or that phenol is an alkali, or that the Critical Micelle Concentration of a surfactant can ever be tolerable in a water targeted for processing for drinking purposes) even though the result seems unlikely there is no obvious reason why the authors, in their overall ignorance, should realize that the expected Al concentration would be unreasonably high considering they expect to remove a concentration of phenol which would be unrealistic (too low for an attempt to recycle/recovery). In principle this should be an irrelevant question if the experiment was a regular micellar flocculation one.

But there is a peculiarity in this experiment. Unlike previous work, it was carried out while air was bubbled through the solution as flocculation took place. This presents an interesting question. It is known that foam can be used to remove the foaming surfactant but also other chemicals present, adsorbed on the surfactant layer of the foam. There is for example work on the removal of moderate amounts of phenol in SDS foams.

What if the foam actually provides a barrier that may be crossed by ionic pairs or ionic molecules? What if on the air side they can remain for long enough for a shift in the effective equilibrium of solution, becoming an electrolyte sink? Figure 5 illustrates the idea.

CONCLUSION.
On the grounds of previous information it is suggested that foams may assist to cause an “enhanced” insolubilistion of salts, which a variety of potential technological applications.
The way in which this may be brought to happen would be to use a micellar solution of surfactant, and cause air to bubble in the presence of the electrolytes targeted to produce the desired insoluble salt.


Saturday, 9 February 2013

OBJECTION TO AN ACCEPTED TRUTH: ARE THERE SUCH THINGS AS INSTRUMENT EFFECTS AND REPRODUCIBILITY ERRORS?


Although the first section is mostly a repeat of a previous blog, I think it is better to include it. The proposition is that ignoring the dustortion of the surface excess in solution chemistry has an impact in creating perceived "non'idealities" and "experimental" and reproducibility errors. Such errors would not exist, but be the consequence of assuming bulk phase models to be true. This distortion plus precision errors and real human errors would be the sources of non'reproducibility and dispersion of data.


INSTRUMENT EFFECTS: AN EXAMPLE.

After showing in previous blogs that that the surface excess model of solubility lends itself to predict the existence of a constant solubility product while a bulk-phase concentration model would beg for a variable solubility depending on initial concentrations, we are going to show how observed variations in the absorbance of samples with length of optical path can be explained by a surface excess model (Talens, 2011). Let us assume two spectrophotometric cells, both 50 mm high and 10 mm wide, with a depth of 1mm and 10 mm. It is trivial that this can lead to a lower concentration in the narrower cell due to the higher “stress” caused on the resource (the number of molecules) by stretching the surface per unit of volume. It only takes k to be a significant number, which it often is.


If we reconsider the expression for the light absorbance of a solution, to include both surface excess (twice, as there are two surfaces involved in the absorbance test) and bulk phase concentration and take the 10 mm depth cell as reference


the distortion expected for the 1 mm depth cell is:


One thing explained by the 2 weight factor for the surface excess contribution to the absorbance is why often reducing the thickness by a factor does not lead to the same drop in absorbance. Of course, this has been explained away by entrance effects etc, but the point here is that certain levels of intrinsic human irrationality (adherence to magical explanations, gremlins, and some form of “original sin by proxy”, assuming man made artefacts are meant to be intrinsically flawed because, well, they are man made) may be interfering with our better judgment.

There is a potentially very important implication in this example about colorimetric reading distortion by surface excess. Do surface excesses distort readings in general? If a chemical reaction takes place at the surface of a solution primarily, and we are controlling the temperature with a thermometer which generates its own surface, is the local temperature different than the bulk temperature one? How many of our readings are surface property readings, and introduce a distortion when we assume they are bulk phase? Does this influence scale-up factors in the chemical industry, for example? Are our Platonic “Myth of the Cave” shadows on the surface of liquids?

REPRODUCIBILITY.

The second aspect of this discussion is about reproducibility. If the end point of a tritation was really the condition where the content of a certain chemical has been depleted so that its surface excess is not high enough to keep reacting, then some of what we call experimental error may be just a device - related  dimensional adjustment factor. Equation Set 2 shows a set of equations. Equations a) and b) indicate the equations for the linear portion of the relationship between surface excess and concentration of titration target T and titration standard S at the end point  “ep”. The initial number of moles of the target T will be equal to the titrated (reacted) moles plus the residual moles at the end point (equation d). The residual moles will be equal to the surface excess time area of the volume plus bulk concentration in equilibrium times volume  (equation d). Equations e) and f) show that if the area changes and the volume remains constant the surface excess and bulk phase concentrations of the target change. This may seem strange because of the stated hypothesis that the surface excess dictates the end point and should be equal, until we remember that this area/volume change also affects the titration standard, and that the condition for end point is not a surface excess value but the product of two of them (equation g).


Equations h) and I) give trivially the final concentrations of the titration standard for a titration with 1:1 stoichiometry , which would be the titrated concentration of the target plus the end point concentration of the standard. Equations j) and k) show that, for a substance AnBm assumed to have a conventional equilibrium constant it is perfectly reasonable to expect a discrepancy in the experimentally calculated value derived from a dimensional setup distortion (equation l). With standard glassware nowadays it can be expected that such distortions will be smaller than in the past, and with chemicals where the surface excess is smaller the distortion will be less important, but nevertheless the prediction can be used to verify of this theory.

References
Plato, “Book VII” in: The Republic

SOLUBILITY CANNOT BE A BULK PHASE CONDITION

© 2013 Federico I. Talens-Alesson


Solubility in the bulk phase?

For AlPO4, the solubility product Ksp equals 9.84 10-21. Apparently, it is not possible for around 10-10 mol of such salt to be dissolved in 55 mol of water. This means that up to 6 1013 molecules of salt can be dissolved in 3.3 1025 molecules of water. This means that a single molecule would break up and saturate the volume occupied by 0.5 1012 molecules of water. When the aluminum cation and the phosphate anion are each surrounded by a pack of one million molecules of water, then the surrounding 499,998 packs of one million molecules of water would be unable to hold a single aluminum or phosphate ions. It is hard to believe that a bulk phase model can explain this system. We can take it as an(other) exception to the general principles of chemistry, or we can assume that it tells us something is wrong.

On the other hand, let us consider a cube with a 10 cm edge. Yes, containing one liter of water and 6 1013 molecules of aluminum phosphate. The surface of the cube is 600 cm2, or 6 1018Å2. Let us assume that formation of ionic pairs Al:PO4 against the competition of solvation at the surface of the liquid decides whether precipitation occurs or not. Are the cations and anions within range of each other for ionic pairs to form? If we use Bjerrum correlation for the critical distance for ionic pair formation (it is a bulk phase equation, so it could still be biased, but lets go for it) we obtain a critical distance of 32.13Å at 25C (the distance would be 3.57 ∙│+3│∙│-3│). The surface controlled by every ion would be that value to the square, around 1000. And there would be two ions to the molecule, giving a total “area coverage” of 1000 ∙ 2 ∙ 6 1013 = 1.2 1017 Å2.

It still falls short by an area factor of 50 or a distance factor of 7, but it seems less of an act of faith to rationalize this discrepancy, particularly having considered the ions dimensionless. For example, if a shorter inter ion distance does not allow for solvation spheres to remain efficiently formed between phosphate and Al3+ ions, then this would explain why the total concentration required to reach the solubility product does not need to comply the Bjerrum correlation even if all of it is at the surface. Or maybe the model can still be wrong. But the feeling that the balance of probabilities might be in favor of something closer to the surface excess model than to the astronomical numbers of the bulk phase model is still there.

A plausible alternative: surface excess model for the solubility of a salt.

Let us assume that the first requirement for a salt to reach saturation is that, if present as a solid, the rate at which its ions will react with a solvent and becoming solvated and breaking away is balanced with the rate at which its surface excess will cause precipitation. Let us assume that it will precipitate wherever a sufficient surface excess happens anywhere in the solution, included the surface of any solid salt present. Notice this does not necessarily mean the air water surface: could mean any surface, like that of seeding particles or already formed crystals. Or a pipe wall or a membrane/filter. It is reasonable to assume that the surface excesses for each counter ion in a salt will be on average deployed at different distances of the surface as the solvation number will be different for both ions. Some research on the Ray-Jones effect ,a minimum in the variation of surface tension with the concentration of certain electrolytes at a concentration 1mM (Petersen and Saykally, 2005) suggests such offset would be part of the explanation of the effect.

In practice, it could be looked at as some sort of parallel surface excess planes containing each of the electrolytes (below) . Of course, the molecules and ions in this surface layer will be renewed by agitation, which is nearly omnipresent in chemical experimentation. This may also have an effect on which counterion is rejected faster by the solution by denying to it solvation water (or the relevant solvent in the case of a non-aqueous system).
Anions and cations circulate due to agitation between the bulk phase and the surface and back. If the associations are only stable in the high concentration surface region, they will dissociate, but why should they otherwise?

This model depends on the electrostatic attraction between the ions overcoming the separation between the planes containing the surface excesses (below) for reaction to occur.
The density of particles increases the electrostatic attraction: the difference between attraction (left) and complete separation (right).

When the surface excesses reach certain values and raise the surface plane “charge density” , then some of the ions may migrate towards each other and form ionic pairs of lower net charge. This may reduce the electrostatic attraction between the surface planes to the point that the migration does not happen any more and there is no reaction. This may have resulted in precipitation, or merely in the formation of an intermediate soluble species. The products and unreacted reagents migrate to the bulk phase due to surface renewal caused by agitation. There they would remain in whatever state they acquired at the surface until they re-enter the surface excess region. Because, if an ionic pair forms, why should it break up in a diluted solution. where the solvent could not prevent the pairing in the first place? And if it breaks up, because it was only the local high concentrations that drove it to form, why should it reform in the bulk of the liquid?

Of course, we know that some state of flux between species exists in solution. But this could be explained simply by a competition between surface excess components to exchange with a component of a particular ionic pair as it re-enters the surface excess region, and not a bulk-phase phenomenon (below).
”a” represents a kind of ions present in one of the surface excesses, “b” represent the counter ion present in the other. The figure shows how an already formed aggregate, present in the bulk phase, may re-enter the surface region and exchange part of its components.

How we would notice the difference? The surface excess would be up front the sensor, unlike the bulk phase concentration. If the condition for precipitation is that a given electrostatic attraction pulls together the ions on both concentration planes, this is actually independent of the individual superficial concentrations, and only depends on the product of the surface charges reaching a given value. This formally explains the solubility product of a salt: different values of surface charge density at both planes can yield the same electrostatic attraction, required for the reaction to take place. This can be seen as a product of concentrations, because the surface excess is a function of the bulk phase concentration (below). The detailed discussion, expanded to equilibrium constants and kinetic equations can be found in The Weierstrass Snare post.
If the attraction is electrostatic, it is irrelevant whether the charge density is contributed by one or the other of the ions suitable to cause the reaction.


Objection to an accepted truth: A bulk phase solubility condition without cheats.

The main difference between a bulk concentration and a surface excess model is the absence of a singularity: the condition must be met throughout the solution. We still should assume that ionic pairs must form as preliminary or be a trigger condition for precipitation. Therefore, that some form of critical distance between counterions must exist, even if it is not Bjerrum's. Extremely low solubility products, which can never be explained with final concentration links to ionic pair distances, will be dispenses with considering that their existence as precipitates is a consequence of the initial stages of mixing: after all Al(OH)3 may precipitate with different forms and very different solubility products, purely as a consequence of mixing conditions. Therefore, the condition may have been met during the mixing and almost no precipitable materials “survived” the mixing. This is already a concession, as in fact these extremely low solubility compounds would be against the bulk-phase mechanism because their justification would be a transient mixing condition.

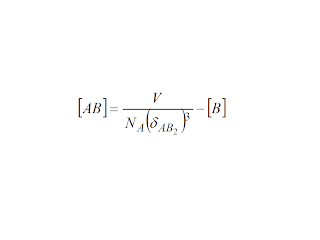
There are a number of problems. The model assumes homogeneous mixing. Let us say that the target precipitate is AB2. A+2n is present in a given concentration. B-n is added. There is no real reason for any AB2 molecules to come apart in the bulk of the liquid if it has formed there. Remember, what we see may deceive us. We have already given a surface excess alternative to dynamic exchange or reconfiguration in solution. Just because high energy, fast moving molecules in a gas mixture may experience collisions between them and with the walls and change there (the equilibria in the synthesis of ammonia or sulfur trioxide, for example) does not mean that slow, shielded (solvated), low energy ions in solution should behave in the same way.

The possibility of AB2 to form before all A+2n as reacted to form AB+n could depend on the mixing conditions. As solubility products are constant and generally do not do this, we must assume that AB2 only forms when AB+n has formed in sufficient amount. We should remember that we should let the models predict dynamic equilibrium and the mathematical form of solubility products without our help. If a compound in a diluted solution forms in the bulk of the solution, there is no reason for it to decompose and reform continually. If we assume that any ion-ion interaction depends of a characteristic distance to happen (below) then we can develop a set of equation to describe the process.

If there is such characteristic distance for the interaction of A and B, then interaction will occur whenever the whole volume of the solution is encompassed by the two ions:

A + B must be equal to 1 for the solubility condition to be reached. If this is the case, then the trivial development for the precipitation equation is:

The relationship for a solubility condition clearly goes in the lines of one rises the other lowers, but it is not mathematically equivalent to a solubility product. If the sequence is not A+B equal AB, but A +2B equal AB2, then there would be a subsequent condition

between the intermediate species AB and B, with a relationship again of the form

It is hard to see how these equations have any connection with conventional solubility products. So, the fact is that following a rationalist approach, instead of an empiricist one allowing for a mixture of empirical facts and axioms, bulk phase solubilities do not look like the real thing, while surface tension-related solubilities do.

References.
Petersen, P.B., Saykally, R.J., Adsorption of Ions to the Surface of Dilute Electrolyte Solutions: The Jones-Ray Effect Revisited J. AM. CHEM. SOC. 127(44), 15446-15452 (2005)
F. Talens-Alesson (2011) http://chemistry-f-talens-alesson.blogspot.co.uk/2011/09/some-g-g-and-d-symbols-in-text-must-be.html

Thursday, 7 February 2013

Surface Tension in Liquids: the structure and properties of the tension layer


© 2013 Federico I. Talens-Alesson


This manuscript discusses the idea that the boundary layer of liquid, where surface tension manifests itself, has an impact on a range of phenomena occurring in solution. It does it by being a region of singular viscosity and density compared with the bulk of the liquid. As such, it is the packing of molecules of solvent near the surface of the liquid influences the occurrence of surface excesses of solutes. Other phenomena are also described.


It is accepted that intermolecular forces in a liquid reach a singularity at the boundaries of the liquid with gas and solid phases. The molecules at the surface are pulled inwards in because there are no “outward” pulling forces. That creates the phenomenon of surface tension.

It is known that under certain conditions some liquids deposit layers on vertical or even upside down surfaces, continuous and well above the surface of their main surface, in a phenomenon linked to capillarity. Such liquids are called “super creepers”  and there is a maximum thickness to their layers coating surfaces higher than the surface of the liquid itself.

 There are many interesting questions about how this surface tension works. Amongst these, one is how surface tension modifiers work, and another is how surface tension plays a role in heat and mass transfer in multiphase flow.


Surface Tension and Surfactants.

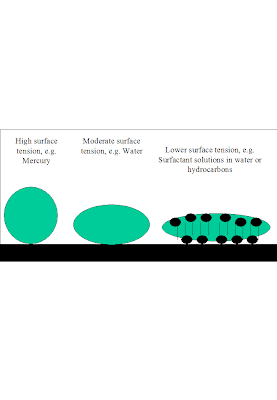
Surface tension is seen as a force that “tenses” the surface of a liquid. The higher the surface tension the more difficult it is to ripple the surface. This is a relevant technological question, as ripples (or waves) on the surface of a liquid have an impact on phenomena like the ability of a gas-liquid absorption device to perform, or the ability of a heat exchange device to perform, because in some cases such devices consist in pipes with liquid  circulating along their walls “pushed” by a core of gas streaming through the center of the pipe. The ripples play a part on how much mechanical energy is transferred from the gas to the liquid to facilitate the latter's circulation. The “surface tensing” is also observed in the fact that, the higher the surface tension, the rounder will be the drops of liquid on a solid surface. Reducing the surface tension to flatten drops of liquids on solids and increase contact angles is part of wetting and detergent technologies, for example.

Surface tension modifiers, known as surfactants, have a number of characteristics, including the fact that they have a hydrophobic and hydrophilic fragment. Or several from one of the kinds, or from both. Surfactants require a minimum length of their hydrocarbon chain to be so. In aqueous solutions, they lower the surface tension. Sodium butyl sulfate is not a surfactant, sodium dodecyl sulfate is. A peculiarity of the drop in surface tension induced by surfactants is that it does not lead to an straightforward increase in “rippleness” in the liquid surface. A re-tensing effect called the Marangoni effect causes ripples to be flattened out more in a surfactant solution than in a pure liquid which had the same surface tension by its intrinsic properties. Surfactants are considered to insert their polar heads into aqueous solution, and keep the hydrophobic tails above, giving the solution the “hydrocarbon” surface tension.

Alternative View on Surfactants and Surface Tension.

If you have read any of my previous blogs, you will not be surprised to find that I disagree and have an alternative view about the thing works.

Children often play chase games, where one of them has to chase other children. In a variant, the chaser and the first chased join hands and then proceed to chase another child. As the chain grows longer, the centre of the line, which moves abreast to cover more field, is tensed with the children's arms stretched out. However, the children at both ends of the line are invariably pulled inwards the centre of the line. The actual way the mechanism causing surface tension should be looked at in this way: molecules vibrate, and when their vibration is away from a certain molecule they have an attractive force with, they yank it. If they move TOWARDS it, nothing happens but it is guaranteed that when it moves away it will yank the second molecule HARDER. This causes a chain reaction, which combines with other similar “pulls” by other molecules in all directions. The result should be that when there are molecules at long distances in all directions (well, from a molecular point of view), the matrix of the solution should be greatly expanded. When the phenomenon takes place closer to a surface, then the “pull” from that direction is reduced, until it decreases at the surface itself. As a consequence, molecules near a surface would be more tightly packed. By the way, this implies that the liquid near the surface is actually denser and, insofar as the viscosity of a solution or liquid is a consequence of the strength of the intermolecular interactions and the number of interactions per unit of volume (as a consequence of the density of molecules),  more viscid than in the core of the solution.

A possible explanation of super creeping is that the wall does not provide enough energy to “kick out” the molecules depositing on it. The fact that a critical thickness exists would be related to an increase of the intermolecular interactions and the “loosening” of the liquid layer, leading to molecules sliding down the surface of the film. This critical thickness layer hints to a surface tension layer. The surface tension layer would be the layer near the boundary of a liquid or solution where the molecules are more tightly packed and create the surface tension phenomenon. The super creeper liquid film would be a limiting case in which any surface, due to the low energy of the system, could contain a surface tension layer before any excess just slid down because the binding becomes too loose.

I propose that, instead of the usual view, the surfactant molecule is sunk into the liquid as a buoy, polar head inwards, with maybe the final fragment of hydrocarbon chain sticking out. The hydrocarbon chains of surfactants would interfere in a way similar to graphite rods in a nuclear reactor: instead of interfering with the “line of sight” of fissile nuclei “firing” neutrons at each other, they interfere the attractive interactions between the molecules. As their hydrocarbon fragments replace strong water-water interactions with weaker interactions with the surrounding liquid molecules, they “loosen” the surface tension layer, which leads to a loosened “wrapping” of the bulk of the liquid and increased surface to volume ratio. In three dimensions, it would not simply result in the hedges being pushes inwards, but in a more compact three-dimensional structure progressively loosening from the surface to a certain critical distance.

Marangoni Effect.

An explanation for the Marangoni effect follows easily from the above description: when a ripple breaks the surface and causes liquid from the isotropic bulk to surface, the balance of forces within the new surface must be re-established due to the new anisotropic conditions. That implies a densification of the surface liquid in the “gash” which somehow begins to “knit itself” together and as a consequence the hedges of the “gash” are pulled together. This approach is sufficiently similar to the regular approach to be indistinguishable, although it is the complete opposite: the “pull” is a consequence of the “bare bulk” liquid NOT being densified already and having to build up the surface tension. These build-ups are the ones causing the Marangoni effect. But it looks the same as assuming that the “bare bulk” region is a high surface tension area already, which is the conventional view.


Solubility Implications of the Existence of the Surface Tension Layer.

A densification of a polar solvent like water near the surface leads to further proximity between polar groups from solvent molecules. If we consider an electrolyte breaking up during dissolution in a polar solvent, with an anion recognized by current knowledge as having near zero hydration number, and a cation recognized as having 3,4 or whatever hydration number, what we know is that one of them has no tendency to associate with water molecules (for example) and the other does. But there is an issue there. If the anion really cannot hold onto solvent molecules, then it can migrate all the way to the surface and create a surface excess of itself. If the cation has an optimum number of “held” solvent molecules, it will have an optimum deployment place where the attractive forces of the anion surface excess and the polar solvent, and the repulsive charge of the transient bulk excess cation concentration balance. Therefore, the cation will have some form of subsurface excess, because it will be pulled away for the surface of the liquid by the solute-solvent interactions. This actually connects seamlessly with my reaction surface planets theory, and gives an explanation to why there would be separate surface excesses for anionic and cationic species.

In the case of a salt AnBm, which dissociates in A+m and B-n ions, the initial surface excesses would be one containing B-n likely to have near zero hydration number and be right at the surface of the liquid, by reason of nothing pulling it back into the solution. The cation A+m will have a tendency to be associated to solvent molecules, and it will create its surface excess at some distance of the surface. However, as the concentrations increase, the electrostatic pull between the two surface excesses causes some ions to meet at an intermediate point, forming ionic pairs AB(+m-n).

These pairs will have their own optimum solvent-interaction characteristics, and therefore their own hydration number and distance from the surface at which to build their own surface excess concentration. This surface excess shields the other two, because it is same charge than one and has a lower to interact with the other. Also, its appearance may have caused some depletion in the other surface excesses. If its distance to the opposite charge surface excess is too large to cause a subsequent step, then the reaction stops there. This explains why in an equilibrium with many species not all of them are present at all times. The reader is referred to the other document to see what the connection between this surface excess layer structure causes the know mathematical definitions for solubility, equilibrium and kinetic equations.

Summarizing, the surface tension layer creates a net which filters the various types of ions, creating a restriction to the relative deployment of the various surface and subsurface excesses versus the actual liquid surface. The solvent density at each subsurface excess plane is not the same, and this brings an interesting question: if the hydration number refers to an optimum value at the surface excess plane, there is no real reason for the value to be the same across the volume of the solution. Also, because even when we use probes we can only sense or measure at the surface of the solution, what we get is a distorted combination of the closer signal from the surface excess and the more distant signal from the bulk phase, which is nevertheless weaker and more diluted. Therefore, sensing indicating a given hydration number could refer mainly to surface excess hydration number, that nevertheless would be the relevant one, as reactions would take place at the surface/subsurface layer level.


Precipitation, Nucleation and Crystal Growth.

An immediate idea is that when precipitation takes place, then any crystals forming would contribute new surface against which surface and subsurface excesses can build up. In fact, the process by which new crystals form (nucleation) should also take place in the surface excess regions. Therefore any air-water interface (e.g bubbles), any liquid-liquid surfaces and any solid -liquid surfaces could cause nucleation (for example, by seeding). Even crystal growth would be a combination of direct assembly of ions onto the surface of a crystal (well formed crystal growth) or nucleation adjacent to the surface of an existing crystal (imperfect crystal growth).

Better structural matches between forming ionic groups and available surfaces would result in higher crystal growth rates and better quality crystalline structures. This is observed in surface coatings, where different chemical compositions of coating baths may lead to a range of amorphous or micro-crystalline coatings.

As a collateral finding, the existence of extended surface (dispersed particles of whatever kind) means that the proportion of liquid in surface tension layers increases and therefore the average density and viscosity of the liquid fraction of a dispersion/ suspension would already increase, irrespective of the impact of the intrinsic contribution of the dispersed fraction. Finely divided materials with higher surface/volume ratios should contribute more strongly to viscosity increases than more coarse particles to “static” viscosity.

While the increase in density is directly connected with the number of particles per unit of volume, the strength in the interactions between molecules causing viscosity will depend on a potential law of the distance and a function accounting for the number of interactions. The inverse square of the distance of interaction is:

(4π/3 ρ)^(2/3) = 1/r^2 α Fintermolecular interaction

where r = n/V is the particle density and the number of interactions between the n particles in a volume unit V is:

leading to a “energy per unit of volume and unit of time”(dimensions of dynamic viscosity) proportional to a function of the form:

This function shows that there is a link between increase in density and viscosity for a given liquid by the mere presence of an interface or boundary. The meaning would be the energy used up to generate the “pull around” required in a moving fluid: larger values for more viscid liquids, smaller values for less viscid liquids.

Let us go back to the question of suspensions of particles. Let us assume that the effective (average) viscosity has a proportionality to the viscosities and volume fractions of the bulk phase and tension layers. Let's assume that the average viscosity of the liquid in a dispersion can be considered an average of the bulk phase and tension layer viscosities. This is in conflict with the forms of viscosity equations for mixtures of substances, but it leads to an interesting result. Follow me.

where V is the volume of the liquid, and VB and VTL are the volumes of the bulk region and the tension layer:

The volume does not specifically includes the volume of the materials dispersed, but it takes into account their presence through VTL:


where AP is the area of the periphery of the solution, dTL is the thickness of the tension layer, and r and n the radius and number of particles contained in the volume of liquid V (which is not the same as the volume of the sample, which would be Vsample = V + Vparticles). Reorganising, the ratio between the effective viscosity and the „intrinsic“ viscosity  of the bulk phase looks similar to Einstein's equation. It also does not appear very different from Taylor's equation for fluid drops with a different viscosity to the bulk liquid:

It is worth stressing that the development proposed starts by assuming that the effective viscosity  is an average of bulk phase and tension layer viscosities, and yet produces the same kind of trend. A likely explanation is that, for the purpose of the example, there is no change in the nature of the inter particle forces. Therefore, an average of the internal “pull around” or cohesion tension (a way to look at viscosity) across the volume between different density regions makes sense for a given chemical composition. The role of surface excesses in fine-tuning the viscosities of the system still needs to be taken into account.

An interesting question is whether an increase in viscosity within the surface tension layer also increases the apparent viscosity of the bulk volume by creating some sort of molecular “bag” which holds the bulk volume together and restricts the mobility of the inside liquid. The response of this “bag” to the mechanical shear stress over a liquid may play a part in the occurrence of the various rheological behaviours found in liquids, suspensions and dispersions, like rheopexy or tixotropy. For example, if the increase in shear streamlines the tension layer molecules, but then as the shear stress decreases the molecules get entangled, this would result in a rheopectic behaviour.

Finally, there is the question of the dependence of (mu)TL with the nature of the surface and any substances adsorbed onto a dispersed phase. Molecules adsorbed onto particles (e.g. clay) may have a surfactant effect (disrupt the tension layer) or thickening (consolidates the tension layer). This viewpoint may be useful when considering the role of various additives in suspension/dispersion/ flocculation technology.


Wednesday, 17 October 2012

Are Molecular Orbital Hamiltonians actually black-box neural networks?


Regarding quantum physics The Copenhagen interpretation was recently summarized as “Shut up and calculate!” That’s blunt, but not completely unfair. It is, in fact, the right injunction
for most physicists most of the time.” say Rosenblum and Kuttner (2006).

A very simplified discussion on molecular orbitals excerpted from Levine (1977) follows. A Slater type orbital (for example, for a 1s orbital) has the form:
Molecular orbitals can be constructed with linear equations:
Following the Hellmann-Feynman theorem
it is possible then to calculate the molecular orbital energies. Levine(1977) cites Parr (1963) saying “We have at our reach precise descriptions of molecules”. That is, Parr's position is that advanced quantum chemistry provides a view of how molecules behave. However, we can see that the energy of an electron in an orbital is calculated by an operator which calculates a number of exponential functions f , whose addition multiplied by a set of parameters allows to calculate a set of functions φ, from which an integral is then calculated. That seems quite similar to a neural network of neurons in the first row, n neurons in the second row, and one neuron in the third row. An example of a similar neural network applied to the calculation of chemical activities (figure 1) can be found in Nami and Deyhimi (2011).

This brings the question of whether the calculation of energies for molecular orbitals is really mechanistically based, or just a black box model. We go back to Rosenblum and Kuttner (page 119): "Here’s something to ponder: Suppose the cat was placed in the box and the atom sent into the mirror system eight hours before you looked. The system evolves unobserved during those eight hours. If you find the cat alive, since it has gone eight hours without eating, you find a hungry cat. If you find a dead cat, an examination by a veterinary forensic pathologist would determine the cat to have died eight hours ago. Your observation not only creates a current reality, it also creates the history appropriate to that reality. You might consider all this absurd. Precisely Schrödinger’s point! He concocted his cat story to argue that, taken to its logical conclusion, quantum theory, at least its Copenhagen interpretation, was absurd. Therefore, he claimed, it must not be accepted as a description of what’s really going on."

A perverse hypothesis is proposed. Let us assume that electromagnetic fields, as a consequence of the emissions of subatomic particles, combine in an interference pattern instead of leading to homogenenous potential barriers. Such pattern would create regions of maximum and minimum field intensity, and regions of intermediate field intensity in between. The juxtaposition of the individual fields is represented pictorially in Figure 2(left) by means of cross sections of concentric spheres centered on field generating particles. The illustration does not intend to be rigorous (force lines of a magnetic field have nothing to do with an spherical distribution around the originating particle), but to show the complex patterns resulting of the juxtaposition of individual particle-centered patterns. The arrows try to show how a particle would try to negotiate passage through the field through favorable field intensity regions, which can obviously be regarded as a 3-D maze. Figure 2(right) represents even more schematically the now obvious consequence of the hypothesis: random motion through a potential barrier may result in the particle taking “the wrong turns” and getting out the way it entered. Although not illustrated, a potential well’s effect to reject particle may be the consequence of less interference between particle fields at the boundary of said field making it more “impermeable”. The conclusion would be that a wave function Ψ does not describe a quantum behaviour as we think of it, but is simply a function good at being fitted to give values between 0 and 1 within a certain interval, a probability generator.

A final element of this “heretic” quantum model would be the following: let us assume that considering electrons as basic subatomic particles is flawed because the fact they cannot be broken is due to their high mobility, which prevents the stress due to the impacting energy to break up the assembly of sub-particles constituting the electron, instead accelerating the electron and changing the configuration of the particle. If so, then the Hamiltonian of an electron:

HΨ = EΨ

Would be in fact
He-nΨe-n + ΣHse-ecΨse-ec = Ψe-nEe-n + ΣΨse-ecEse-ec

The subindex e-n would mean electron-nucleus interaction, and the subindex se-ec would refer to the interactions between the sub-electronic particles and the electronic virtual center. As a consequence, what we accept as wave function for an electron would be a combination:

Ψ = ( Ψe-nEe-n + ΣΨse-ecEse-ec)/E

No wonder the integral of the square of the wave function can assume very intricate forms! And no wonder trying to make sense of any steps of the calculation makes quantum theory “queerer than we can suppose”, as Haldane puts it or that Einstein found its implications “spooky” (Rosenblum and Kuttner, 2006, page 3). The fact is that it may be a black box tool with no significant meaning whatsoever: neural networks are precisely extremely good calculation tools with no pretense of giving us an explanation of why.


REFERENCES


Levine, I..N., Quantum Chemistry, (Sp. trans of the first edition) Editorial AC (1977)
Nami, F., Deyhimi, F.; Prediction of activity coefficients at infinite dilution for organic solutes in ionic liquids by artificial neural network, J. Chem. Thermodynamics 43 22–27 (2011)

Rosemblum, B.; Kuttner, F.; Quantum Enigma, 112 Oxford University Press (2006)